


What are the tariffs making up your energy bill, and where can businesses save the most through onsite renewables?
Commercial energy bills can appear extremely complex, making it hard to understand the true price you’re being charged and how best to reduce your costs.
This article summarises some of the key components of your bill to help you determine where you could save if you started to generate some of your own energy on-site.
What Costs do Energy Suppliers Face?
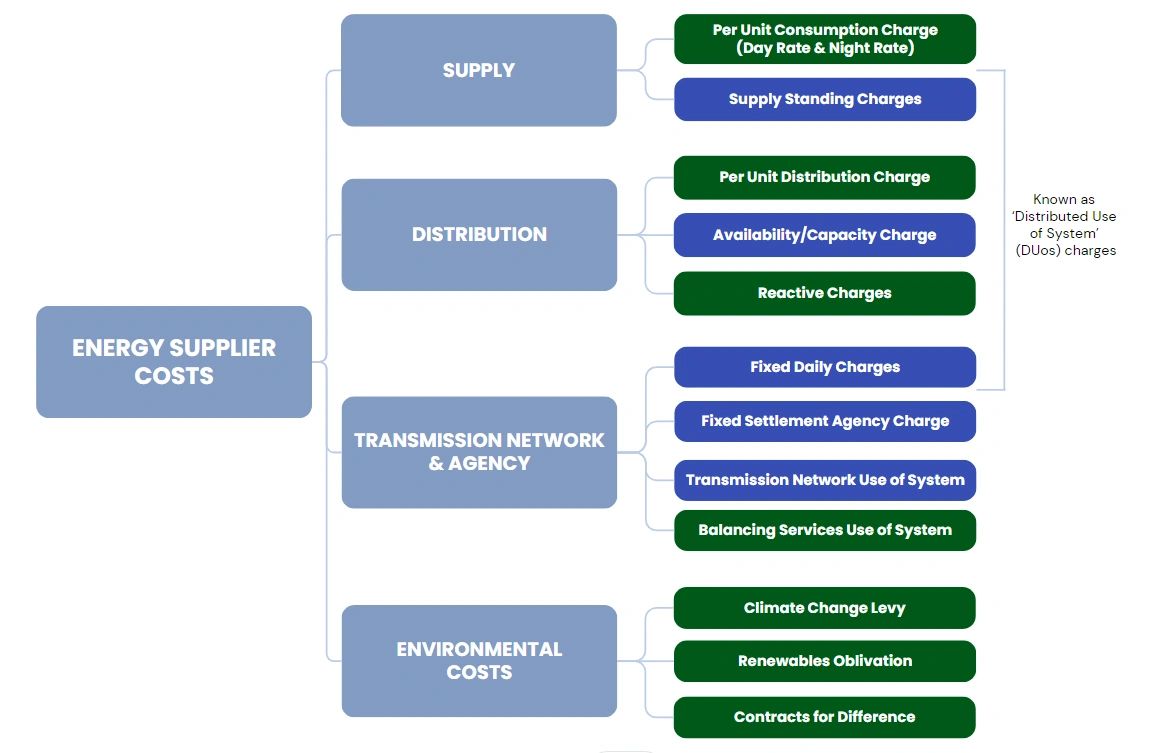
In order to understand your bill and what’s happening to energy prices, it’s important to understand the costs impacting your energy supplier (which are typically then passed onto you, the end user). These are typically broken down into “commodity costs” and “non-commodity costs” as show in the table below.

Commodity costs are essentially wholesale energy costs. Everyone is well aware that these prices rocketed during 2021 to 2023. The good news is that wholesale energy prices are predicted to fall to more reasonable levels in 2024. Whilst they are unlikely to return to pre-covid levels, the shocks that caused the significant upturn in prices have now abated.
The flip side of this is that wholesale prices typically make up slightly less than 50% of your bill. The remaining 50%-60% consists of non-commodity costs. These include distribution and transmission charges which incorporate the cost of maintaining, upgrading and expanding local networks and the National Grid. These costs have risen in recent years and this trend is expected to continue, primarily driven by the UK Government’s efforts to deliver its net zero goals and transition to a low-carbon electricity network. Analysis suggests that the onshore network alone could require £100-240bn of investment by 2050 (Ofgem / BEIS).
The chart below (source: Catalyst) shows the increasing percentage of your bill that is comprised of non-commodity costs.

Let’s now look at how these costs are fed through to your energy bill. The table below breaks down your bill into key categories, identifying those which are charged on a per unit of energy consumed basis (highlighted in green) vs those which aren’t.
What are my ‘per unit’ charges?
Let’s look first at the charges which are affected by how much energy you consume.
1. Consumption charges:
This is the simplest part of your bill: a price calculated in pence per kWh for the amount of energy you have consumed. This price will be influenced by wholesale energy prices.
On-site renewables: Any on-site generation capacity will reduce your overall consumption charges. As an example, on-site solar can typically provide 20-40% of a business’ overall energy needs. This means that your consumption charges could fall by this percent or even slightly more, as solar will reduce your consumption during the day, when your per unit prices are highest.
2. Per Unit Distribution Charges:
Distribution charges are those incurred for the use of the local distribution network operator’s (DNO) distribution system – i.e. the lower voltage networks which take the energy from the high voltage transmission network into individual businesses.
Due to the continued growth in renewable generation, sizeable network upgrades are required and these distribution costs are therefore expected to rise. Collectively these costs are known as “Distributed Use of System (DUoS)” charges and are recovered from bills through a number of different elements including a per unit cost. The amount you pay will vary based on your location (distance from a grid connection point), voltage level and demand profile / available supply capacity.
The table below shows a Drax forecast for YoY increases in DUoS*, in £/MWh:
The element of these costs which is charged on a ‘per consumed unit’ basis is broken down into red, amber and green charges with different rates charged at different times of day.
On-site renewables: You may find that on-site renewables allows you to reduce your consumption from the grid at times of day when ‘per unit’ distribution charges are highest. As an example, “red” charges are typically incurred between 4pm and 7:30pm, whereas amber charges are between 8am and 4pm. The use of solar energy during the day could therefore reduce your energy use from the network during red and amber charge periods.
3. Reactive power charges:
These relate to “wasted power” – i.e. the difference between the electricity supplied and the electricity converted into power that you are able to use. If a large amount of power is being wasted, more current needs to flow to provide the same output – this puts a strain on the distribution network, the costs of which are passed to customers. Equipment that requires inductive loads – i.e. requires an electromagnetic field(e.g. motors and transformers) – causes the electrical current to “lag” the voltage and therefore creates wastage.
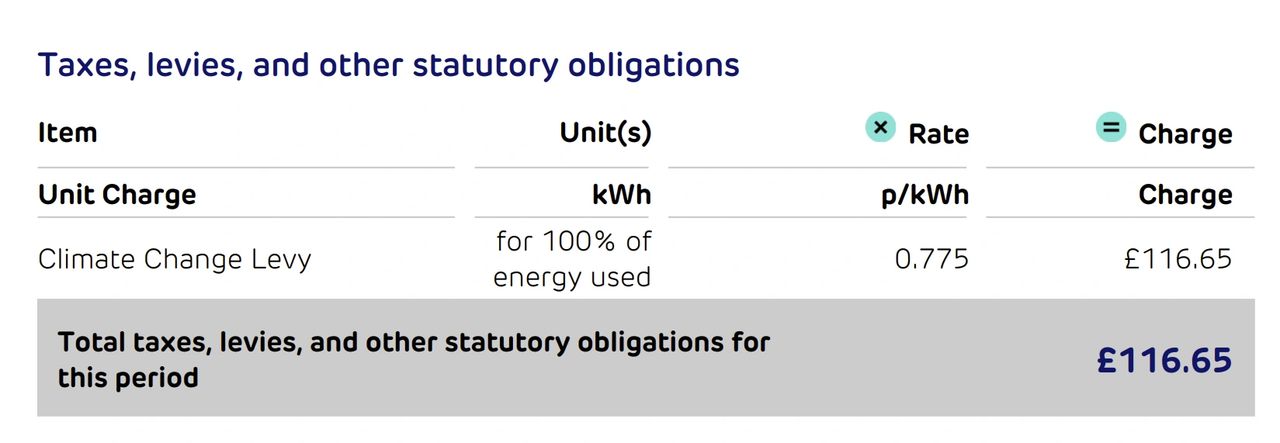
4. Climate Change Levy:
An environmental tax designed to encourage greater energy efficiency, this is charged per unit of energy used. Depending on your business type, you may have some level of exemption. The CCL is reviewed every April.
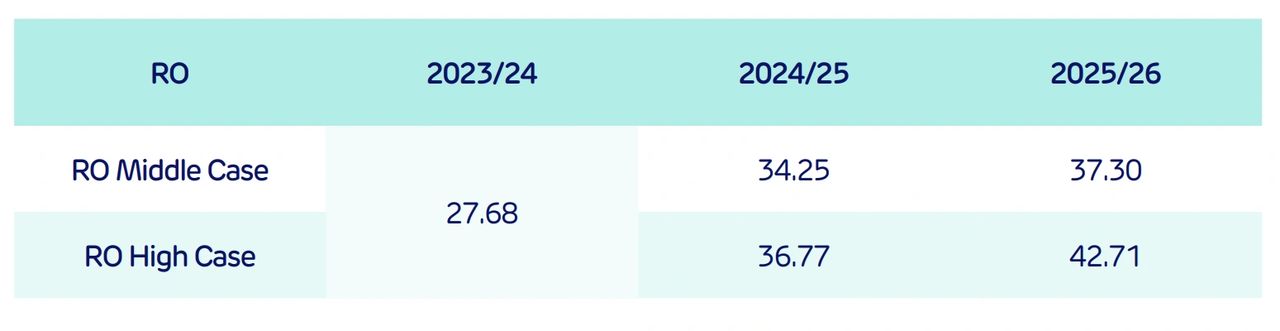
5. Renewables Obligation:
This obligation requires UK electricity suppliers to source a proportion of their supply from renewable sources. Obligations can be met by buying power from an accredited renewable generator or paying a “buy-out” price instead. The level of renewables obligation is set annually by Ofgem. These costs may be passed onto customers – either consolidated into the overall supply rate you pay or as a separate line item on your bill.
Whilst the renewables obligation scheme has been replaced by Contracts for Difference, costs will continue to be levied until 2037.
6. Contracts for Difference:
This levy on suppliers replaced the Renewables Obligation which closed to new capacity in 2017. You may find these costs passed through on your energy bill as a separate line item.
NB: there may also be other government and regulatory levies that exist on your bill such as Capacity Market and Feed in Tariffs
On-site renewables: As the CCL, RO and CfD (and other levies) are a per unit cost, any reduction you achieve in the amount of energy consumed from the grid will ultimately reduce these environmental levy costs.
7. Balancing Services Use of System (BSUoS):
This is a cost charged by National Grid intended to ensure the smooth functioning of the grid – i.e. to manage the real-time balance between electricity and demand and avoid excess or shortage. Prior to April 2023, both generators and suppliers contributed to these costs. However, as of April 2023, the cost burden shifted solely to suppliers (and therefore this element of customers’ bills has also increased). These costs are typically fixed by National Grid for a certain time period and may be incorporated into your unit rate rather than separately itemized.
Fixed charges
1. Standing Charges:
This is the most commonly known fixed cost, charged on a ‘per day’ basis rather than being related to the amount of energy you consume. These charges cover the costs associated with supplying electricity to the site (e.g. cables and meter reading). The cost of your standing charge will depend upon the type of energy deal your business is on, the size of your business, the amount of energy it uses, and its TCR (Targeted Charging Review) band.
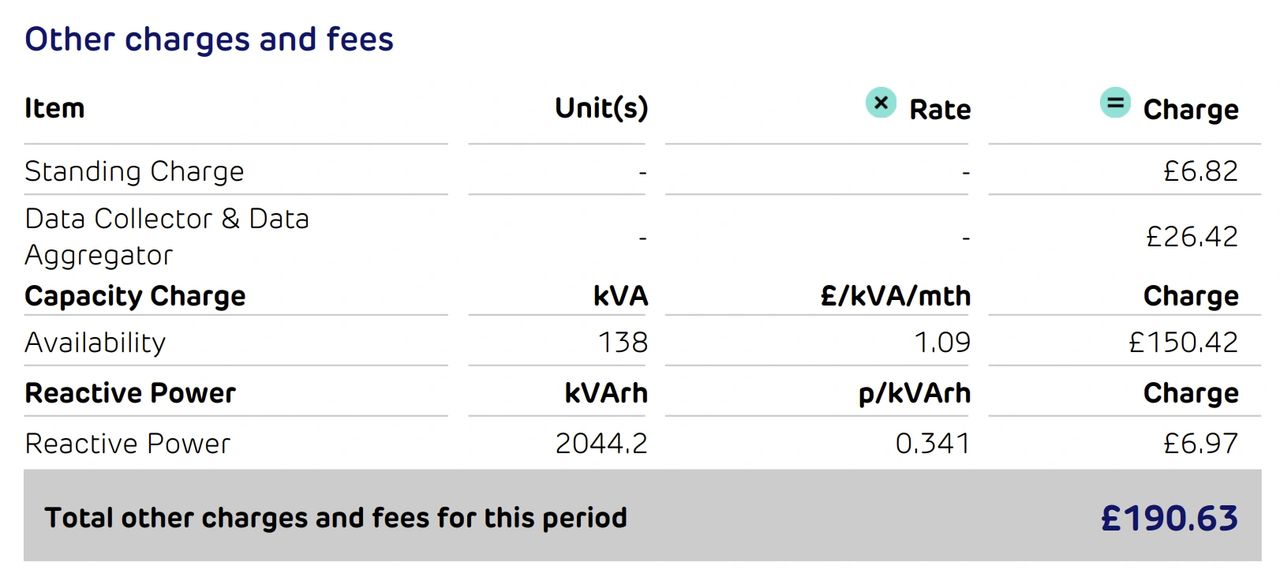
You may find that many of the fixed charges listed below are bundled up into a single standing charge figure rather than outlined separately on your bill.
2. Availability/capacity charges:
This is a charge imposed by your DNO based on your business’ agreed capacity for your site – i.e. the amount of power reserved from the network to guarantee a designated volume of electricity to your supply. You will be charged this regardless of whether you use the capacity or not. However, if you exceed it, you will be charged an excess availability capacity charge. Charges are calculated on a p/kVA/day or p/kVA/mth rate.
On-site renewables: Depending on your consumption profile, you may find that on-site renewables allows you to renegotiate your agreed capacity &/or avoid excess capacity charges.
3. Distribution fixed daily charges:
These are a ‘per day’ cost to cover distribution costs.
4. Transmission Charges:
This covers the cost of using the high-voltage transmission network which delivers electricity from power stations to the regional distribution networks.
Transmission charges include “transmission network use of system (TNUoS)” charges. Whilst not strictly a per unit charge, the amount you pay does have some link to the amount you consume. Until recently, these charges were calculated using a “triad” system in which half hourly metered customers were charged a cost according to their consumption during the three half hour periods in winter when overall demand on the grid was at its peak. However, due to concerns that this system distorted the market by encouraging businesses to shift their consumption to avoid triad periods, a new supplementary system was implemented from April 2023 based on a banded daily charging system.
The band you’re in and the resulting daily fixed charge you pay will depend on your agreed supply capacity – a connection agreement you will have with your DNO which specifies the upper threshold of electricity that you expect to draw and that they must ensure is always available to your supply.
5. Settlement agency charges or MOP charges:
These are the costs associated with maintaining and reading meters from data collectors, data aggregators and meter operators (MOPs) which are charged per MPAN per day. (NB: your MPAN is your meter point administration number – a unique number relating to each meter on your site).
A few final things to note
The extent to which each of the costs outlined above is itemised on your bill will vary from one business to another. However, many energy suppliers are starting to disaggregate these non-commodity costs from your consumption and standing charge costs. Instead these costs are often “passed-through” to customers as separate line items, which of course also passes through the risk of cost fluctuation and uncertainty. It’s therefore very important to consult your energy broker and scrutinize your bill beyond the headline rates.
To read more about how commodity and non-commodity energy prices are likely to increase, check out our article on pricing forecasts.
Drax has also recently published a great guide to third party costs which can be found here.
If you’d like to find out more about how solar could contribute to reducing your energy costs, drop us an email at info@twobluessolar.com